| implot_demo.cpp | ||
| implot_internal.h | ||
| implot_items.cpp | ||
| implot.cpp | ||
| implot.h | ||
| LICENSE | ||
| README.md | ||
ImPlot
ImPlot is an immediate mode plotting widget for Dear ImGui. It aims to provide a first-class API that will make ImGui users feel right at home. ImPlot is well suited for visualizing program data in real-time and requires minimal code to integrate. Just like ImGui, it does not burden the end user with GUI state management, avoids STL containers and C++ headers, and has no external dependencies except for ImGui itself.
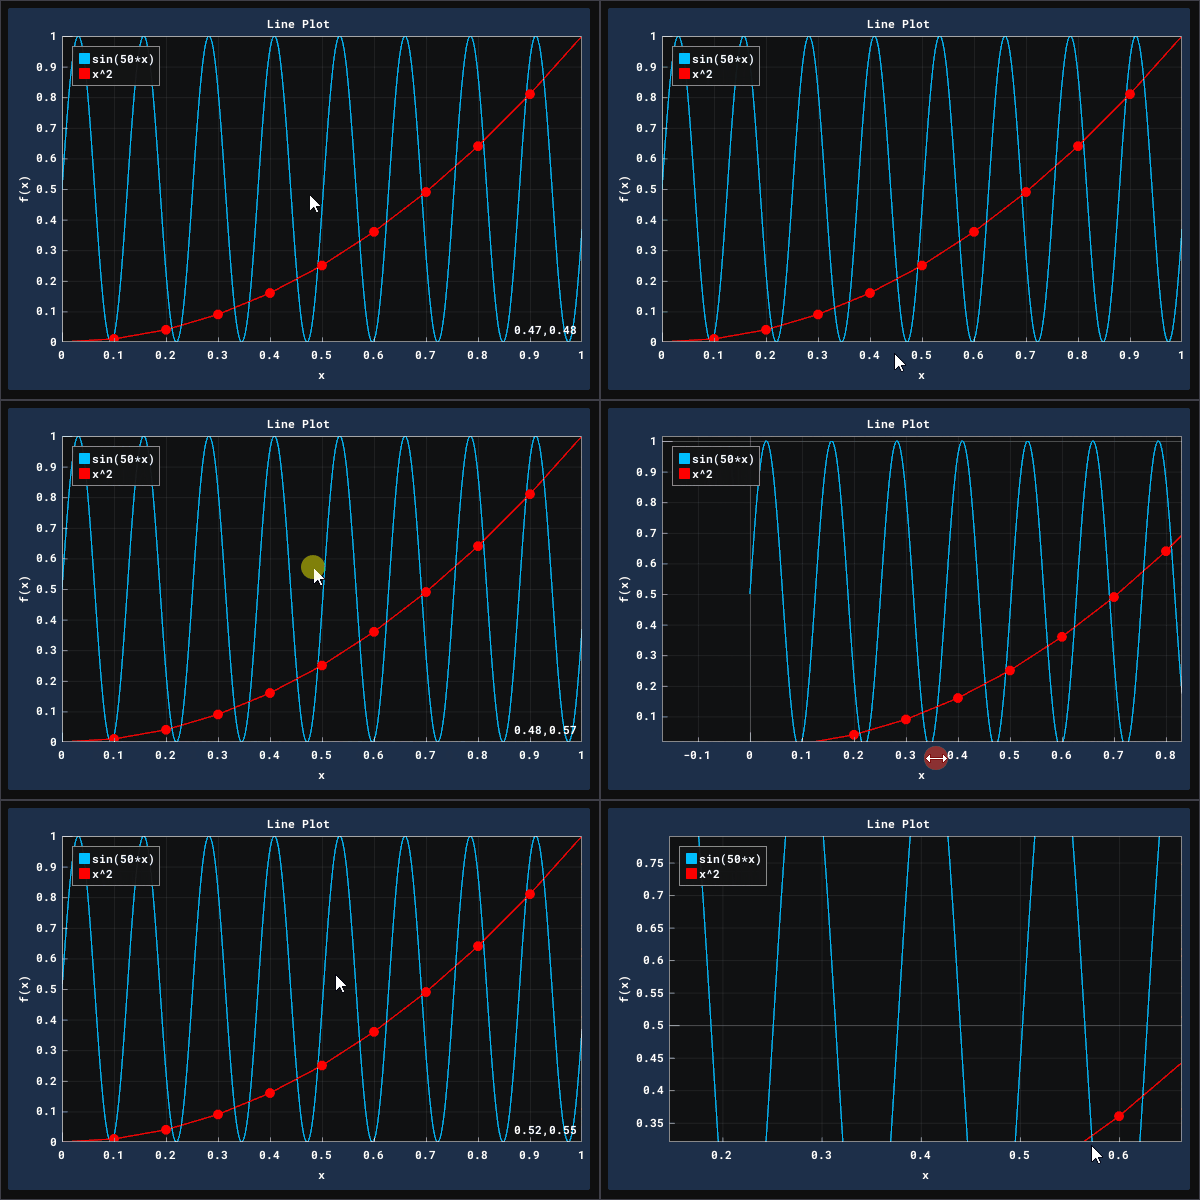
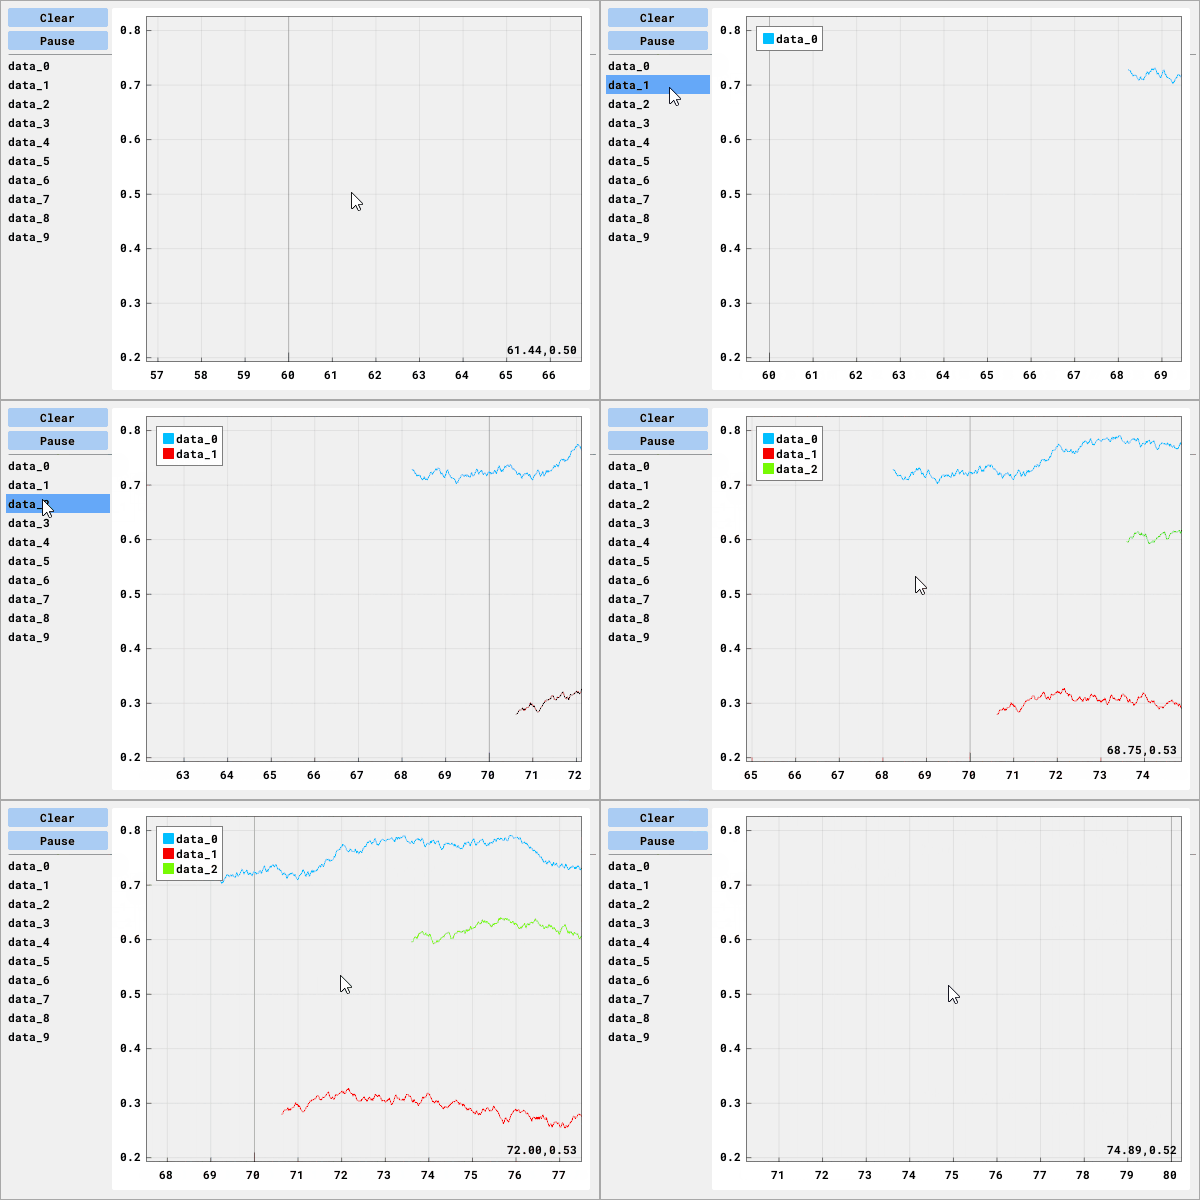
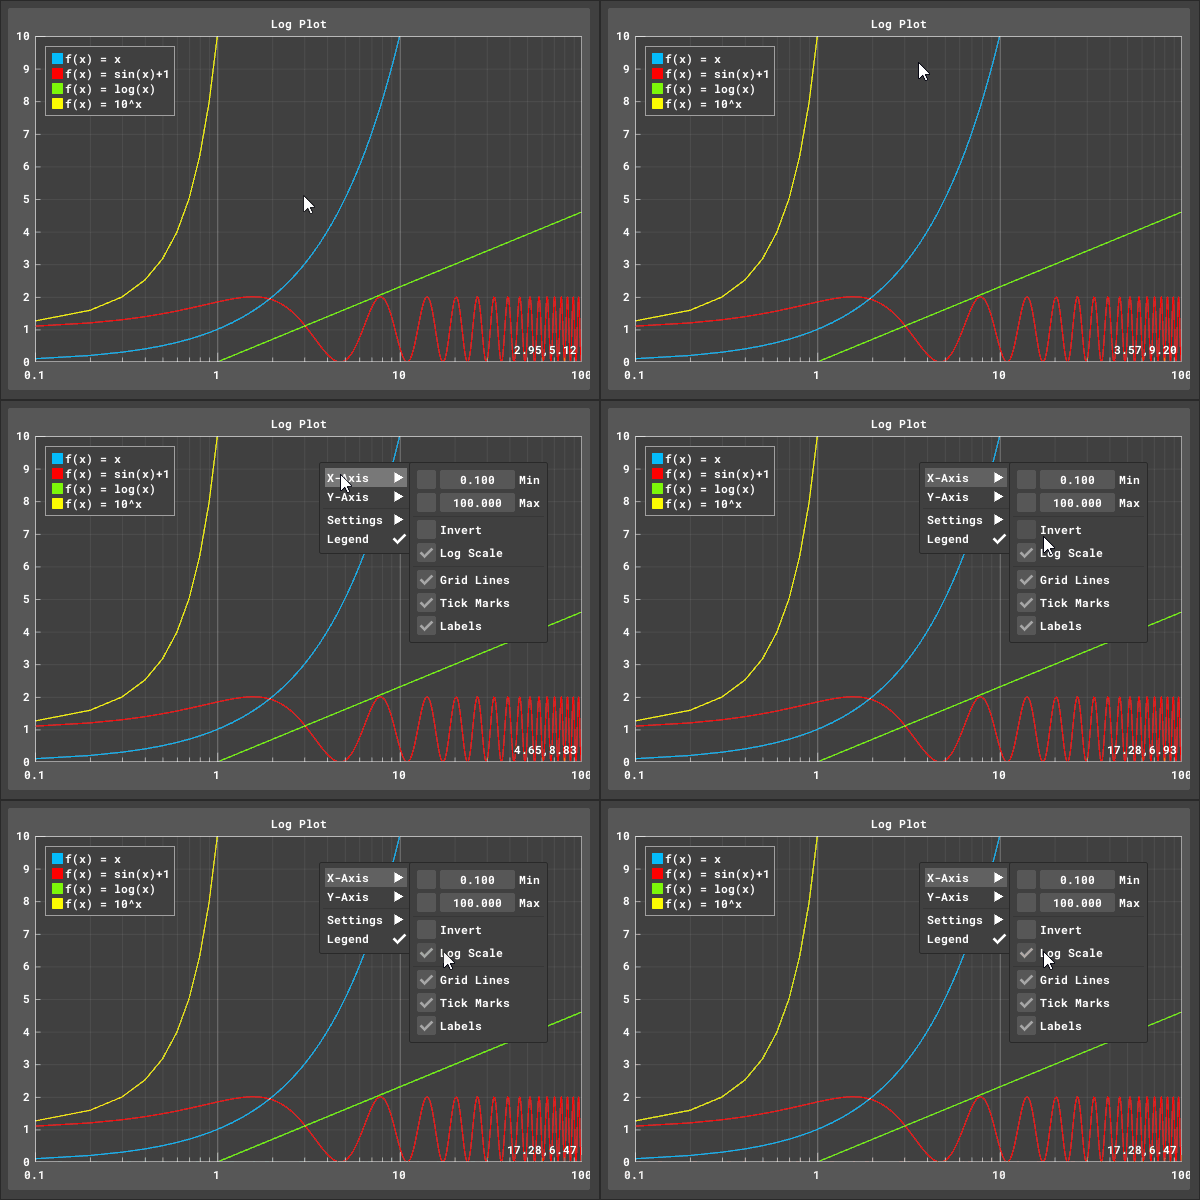


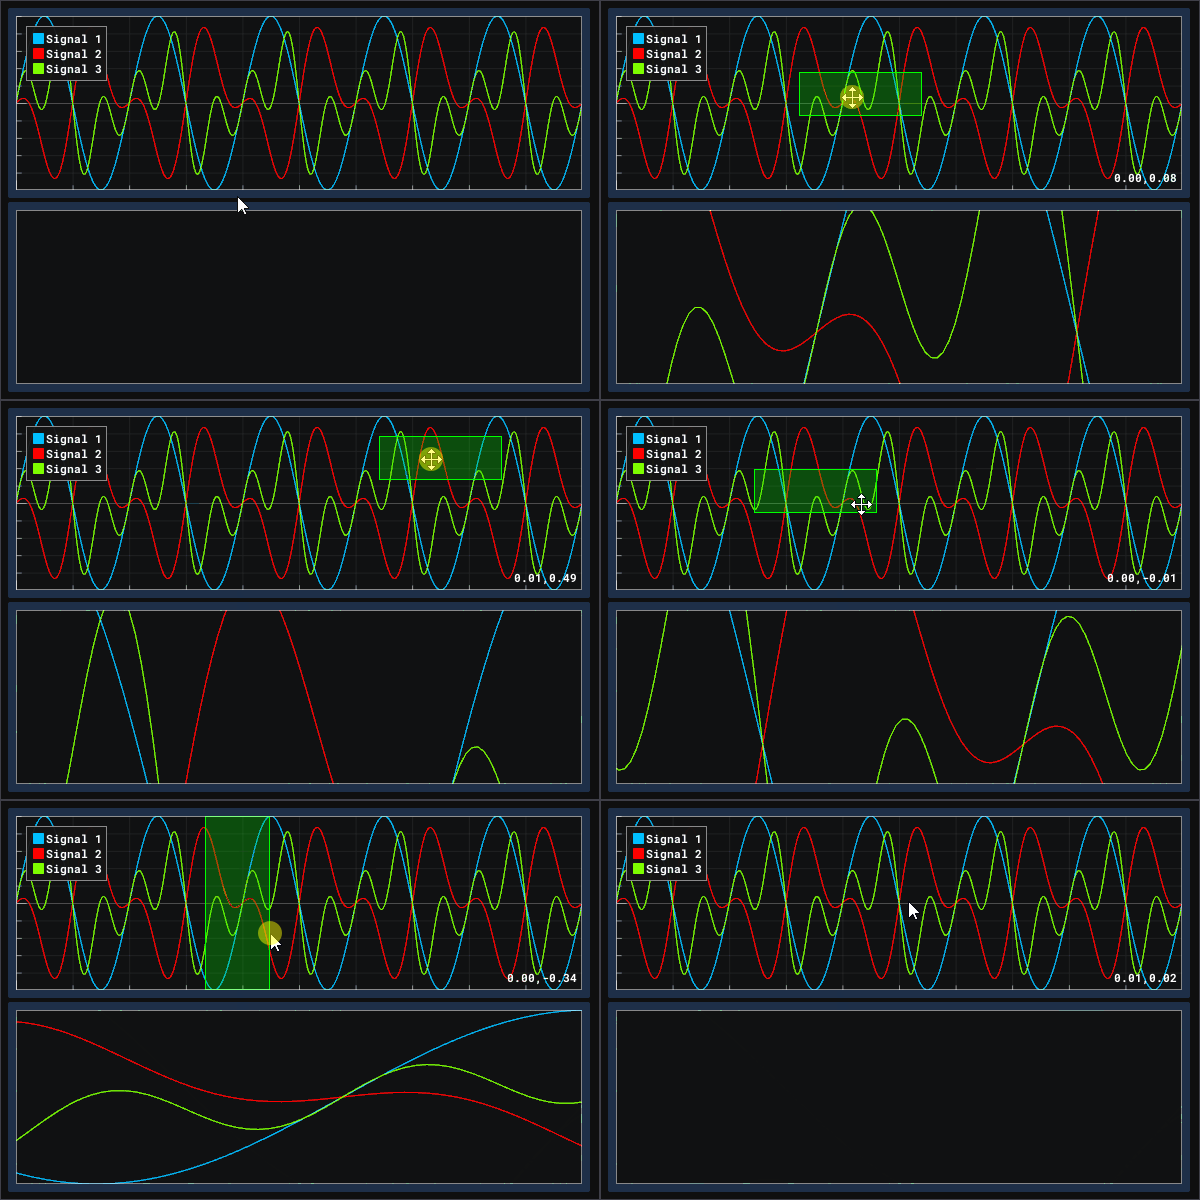
Features
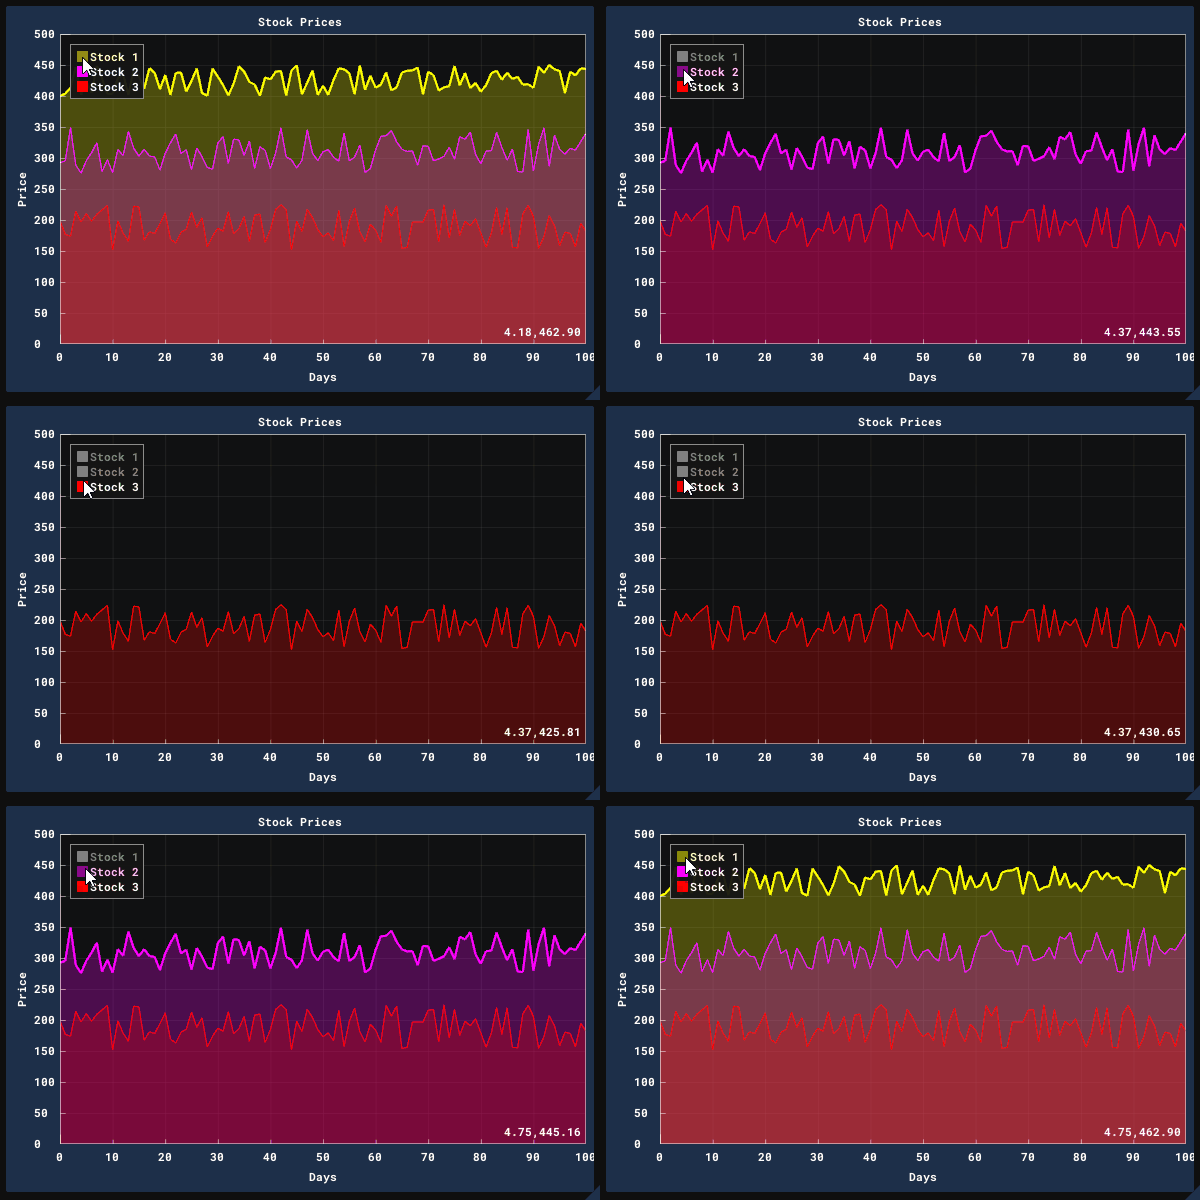
- multiple plot types:
- line plots
- shaded plots
- scatter plots
- vertical/horizontal bars graphs
- vertical/horizontal error bars
- pie charts
- heatmap charts
- and more likely to come
- mix/match multiple plot items on a single plot
- configurable axes ranges and scaling (linear/log)
- reversible and lockable axes
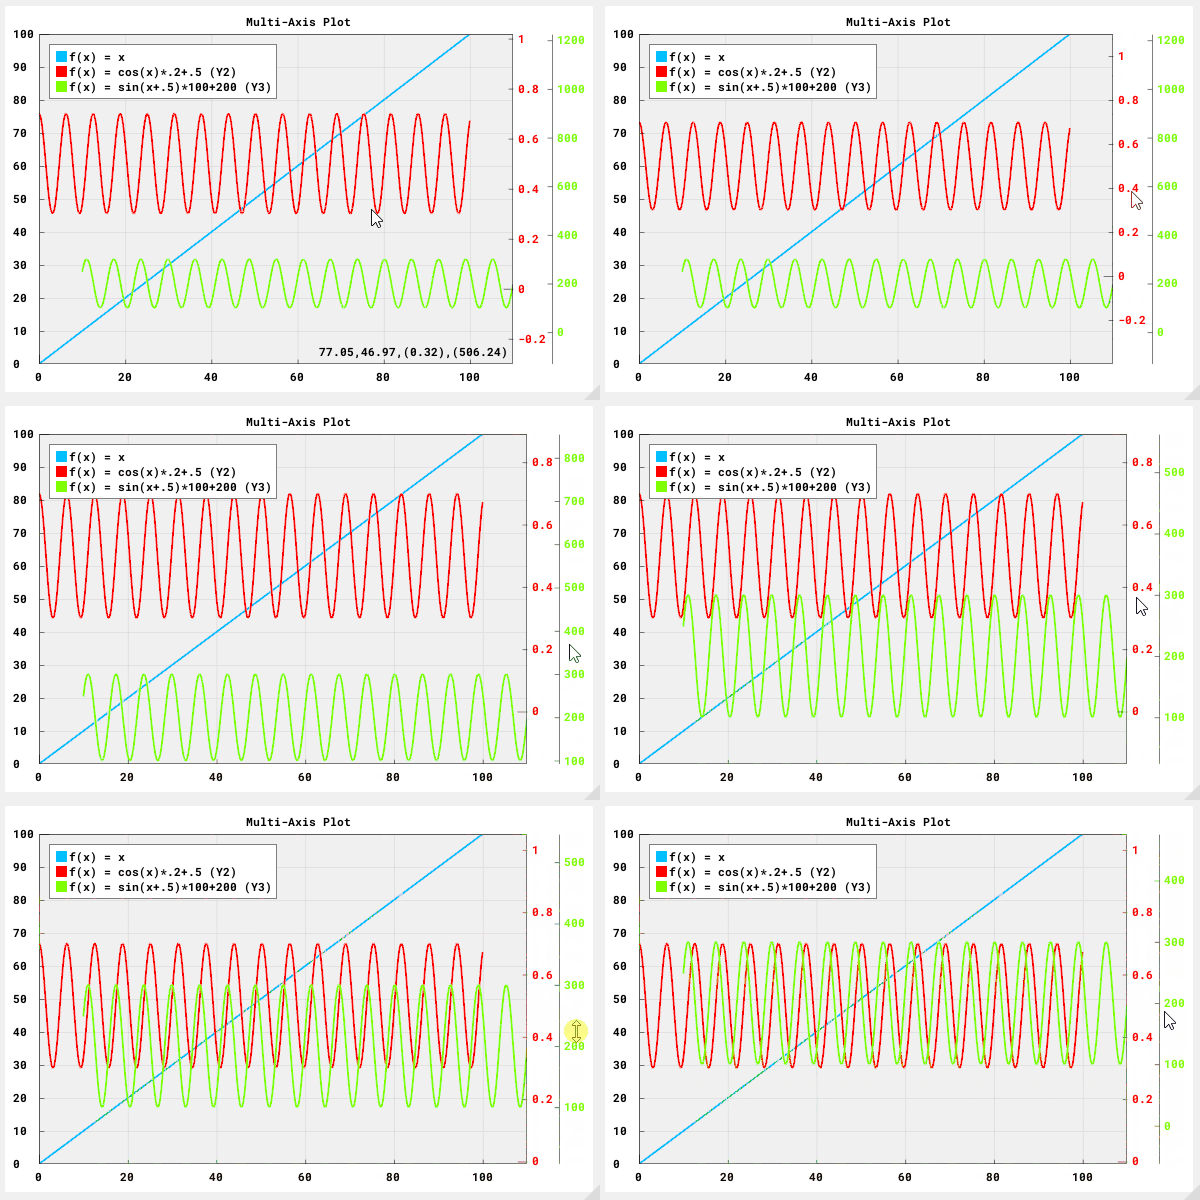
- support for up to three independent y-axes
- controls for zooming, panning, box selection, and auto-fitting data
- controls for creating persistent query ranges (see demo)
- remappable input controls
- several plot styling options: 10 marker types, adjustable marker sizes, line weights, outline colors, fill colors, etc.
- built-in and user definable colormaps
- optional plot titles, axis labels, and grid labels
- optional legend with toggle buttons to quickly show/hide items
- size-aware grid with smart labels that are always power-of-ten multiples of 1, 2, and 5
- default styling based on current ImGui theme, but most elements can be customized independently
- mouse cursor location display and optional crosshairs cursor
- customizable data getters and data striding (just like ImGui:PlotLine)
- relatively good performance for high density plots
- support for single and double precision data
Usage
The API is used just like any other ImGui BeginX/EndX pair. First, start a new plot with ImPlot::BeginPlot(). Next, plot as many items as you want with the provided PlotX functions (e.g. PlotLine(), PlotBars(), PlotErrorBars(), etc). Finally, wrap things up with a call to ImPlot::EndPlot(). That's it!
if (ImPlot::BeginPlot("My Plot")) {
    ImPlot::PlotLine("My Line Plot", x_data, y_data, 1000);
    ImPlot::PlotBars("My Bar Plot", values, 10);
    ...
    ImPlot::EndPlot();
}
Consult implot_demo.cpp for a comprehensive example of ImPlot's features.
Integration
- Add
implot.h,implot_internal.h,implot.cpp,implot_items.cppand optionallyimplot_demo.cppto your sources. - Create and destroy an
ImPlotContextwherever you do so for yourImGuiContext:
ImGui::CreateContext();
ImPlot::CreateContext();
...
ImPlot::DestroyContext();
ImGui::DestroyContext();
Of course, this assumes you already have an ImGui-ready environment. If not, consider trying mahi-gui, which bundles ImGui, ImPlot, and several other packages for you.
Special Notes
- If you experience data truncation and/or visual glitches, it is HIGHLY recommended that you EITHER:
- Handle the
ImGuiBackendFlags_RendererHasVtxOffsetflag in your renderer when using 16-bit indices (the official OpenGL3 renderer supports this) and use an ImGui version with patch imgui@f6120f8. - Enable 32-bit indices by uncommenting
#define ImDrawIdx unsigned intin yourimconfig.hfile.
- Handle the
- By default, no anti-aliasing is done on line plots for performance reasons. If you use 4x MSAA, then you likely won't even notice. However, you can re-enable AA with the
ImPlotFlags_AntiAliasedflag.
Interactive Demo
An online version of the demo is hosted here. You can view the plots and the source code that generated them. Note that this demo may not always be up to date and is not as performant as a desktop implemention, but it should give you a general taste of what's possible with ImPlot. Special thanks to pthom for creating and hosting this!
FAQ
Q: Why?
A: ImGui is an incredibly powerful tool for rapid prototyping and development, but provides only limited mechanisms for data visualization. Two dimensional plots are ubiquitous and useful to almost any application. Being able to visualize your data in real-time will give you insight and better understanding of your application.
Q: Is ImPlot suitable for real-time plotting?
A: Yes, within reason. You can plot tens to hundreds of thousands of points without issue, but don't expect plotting over a million to be a buttery smooth experience. We do our best to keep it fast and avoid memory allocations.
Q: Can plot styles be modified?
A: Yes. Plot colors, palettes, and various styling variables can be pushed/popped or modified permanently on startup.
Q: Does ImPlot support logarithmic scaling?
A: Yep!
Q: Does ImPlot support multiple y-axes? x-axes?
A: Yes to y-axes (up to three), "not yet" to x-axes.
Q: Does ImPlot support [insert plot type]?
A: Maybe. Check the demo, gallery, or Announcements to see if your desired plot type is shown. If not, consider submitting an issue or better yet, a PR!
Q: Does ImPlot support 3D plots?
A: No, and likely never will since ImGui only deals in 2D rendering.
Q: My plot lines look like crap!
A: See the note about anti-aliasing under Special Notes above.
Q: Does ImPlot provide analytic tools?
A: Not exactly, but it does give you the ability to query plot sub-ranges, with which you can process your data however you like.
Q: Can plots be exported/saved to image?
A: Not currently. Use your OS's screen capturing mechanisms if you need to capture a plot. ImPlot is not suitable for rendering publication quality plots; it is only intended to be used as a visualization tool. Post-process your data with MATLAB and matplotlib for these purposes.
Q: Does ImPlot handle double precision data?
A: Yes, ImPlot accepts both float and double for all of its plotting functions.
Q: Can ImPlot be used with other languages/bindings?
A: Yes, you can use the C binding, cimplot with most high level languages.