Split-Pole Spectrograph
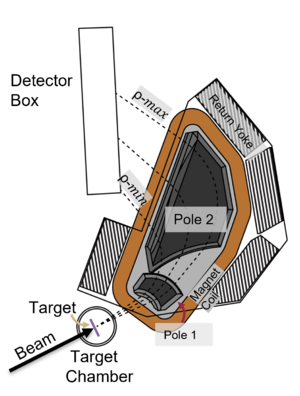 Annotated picture of the SE-SPS, An plain picture is here : File:SPS Magnet.png |
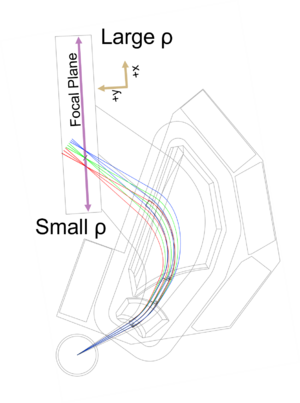 SE-SPS COSY simulation. An plain picture is here File:SPS Sketch With Cosy.png |
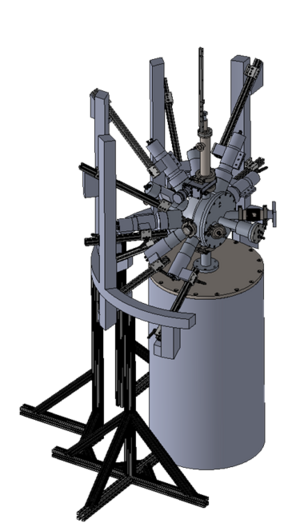
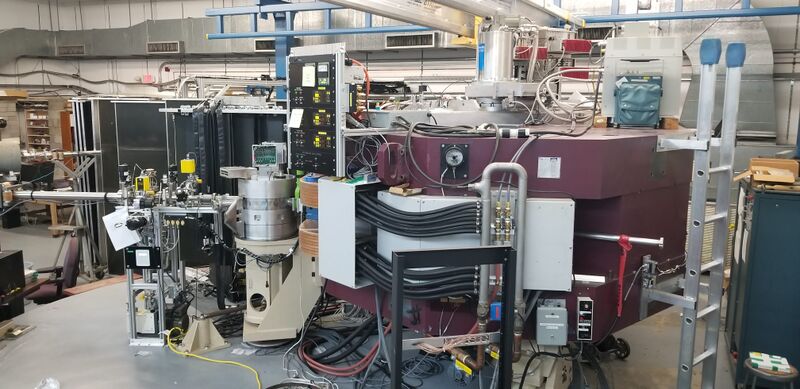
The Super Enge Split-Pole Spectrograph [1] [2] is a magnet spectrometer to measure the spectrum of nuclear reactions. The concept and design were developed by Harald A. Enge[3] at 1967, aimed to have a broad-momentum range spectrograph with or . The spectrometer was originally located at the Wright Nuclear Structure Laboratory (closed at 2013), at Yale University. It was moved to FSU in the fall of 2013. It consists of a reaction chamber, a split-pole magnetic spectrograph, a position-sensitive ionization drift chamber, and a plastic scintillator. It has an angular acceptance of 128 msr (vertical ±40 mrad, horizontal ±80 mrad). The maximum B-field is 1.63 T with a radius of curvature from 511 mm to 920 mm. The mean radius is 600 mm. The advantage of the split-pole instead of a single-pole magnet is the aberration (x|θ2) and (x|φ2) are almost zero [1].
The Super Enge Split-Pole Spectrograph is an upgrade of the Yale Enge SPS. The major change is the redesign of the backward silicon detector array to the SABRE.
SPS Experiment Guide
Media:SPS_Experiment_Guide.pdf
SPS Operating Procedures
I created this section as a place to store procedures for the chamber swaps, however, I expect there are other things we might want to document here. -p
Online Simulator
https://fsunuc.physics.fsu.edu/SPS/
There was another simulator called websps developed by Gordon. But I am unable to revive it after the server upgraded from Ubuntu 20.04 to Ubuntu 22.04, so I write a new one using javascript. The missing part is the energy loss calculation.
Magnet
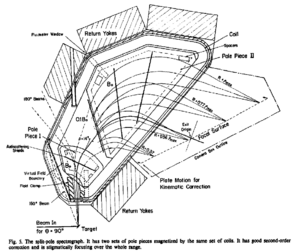
The primary goal of a spectrograph is resolving momentum. A general discussion of magnetic spectrographs can be found at Ref. [1] and Ref. [4]. There are many designs from a simple single dipole to a combination of multiple dipoles and quadrupoles.
The SPS magnet was designed for a large solid angle, large resolving power, and correction of kinematic broadening. Using two-directional focusing and second-order focusing spectrograph can achieve a large sold angle and resolving power. Second-order focusing means the second-order terms in the acceptance angles vanish, i.e. no aberration.
The SPS contains 2 separate poles enveloped by a single coil. The split provides second-order double focusing over a broad range of momenta. The magnet can be rotated from 0 to 55 degrees in the lab. The magnetic field has an upper limit of 1.63 T (or 16.3 kG).
| Property | Symbol | Value |
|---|---|---|
| Orbital radius | 511 to 920 mm | |
| Resolving power | 1st order of 4290 (at mrad) | |
| Acceptance | Horizontal | 160 mrad |
| Vertical | 80 mrad | |
| Dispersion | 1.96 | |
| Magnification | 0.39 | |
| 2.9 | ||
| Maximum field | 1.63 T |
Transfer matrix and COSY INFINITY simulation
| need to fill up. Any 1st few orders transfer matrixes? |
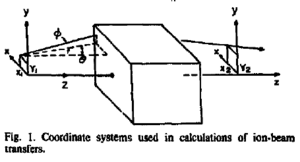
The entrance coordinates of the beam are wiht momentum , and coordinate at exit are . The entrance and exit coordinates are related by
using Taylor expansion:
In the above expansion, the term is the magnification in the x-direction. is the dispersion, and is aberration. The focal plane is the z-position that , i.e. the exit does not depend on the entrance angle.
Kinematic broadening
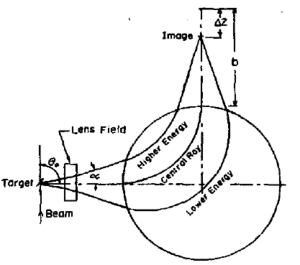
Kinematic broadening is the broadening of focus for the same reaction state. After a reaction, the angle and momentum of the recoil particle are related that the entrance angle is a function of momentum. For each energy state, the relation between the angle and momentum is unique. For example, in a 2-body transfer reaction, the momentum vector is
where are the momentum and the scattering angle at the CM frame, are the Lorentz factor from Lab frame to CM frame, and is the mass of the particle. All 5 coefficients are constant for a fixed energy state. And the different state is characterized by . Defined the kinematic factor K:
The kinematic broadening can be corrected by shifting the focal plane by
Focal plane detector
| The drift ion chamber was repaired in summer 2018 |
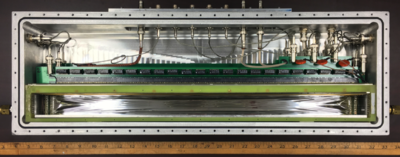
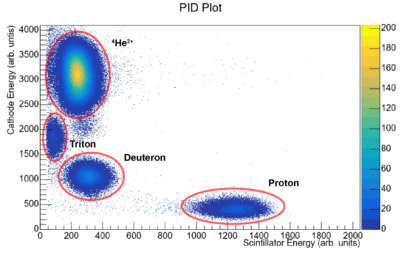
The focal plane detector [5] [6] consists of an ion drift chamber with a set of delay lines to detect the position of a particle along the focal plane and a plastic scintillator to detect the energy of the incoming particle. Using the energy loss of the particle through the ion chamber with the energy deposited in the scintillator, particles of different charges and masses can be identified.
The typical pressure of the drift chamber is 70 to 300 Torr of isobutane gas [HC(CH3)3]. The pressure controls the density of the gas and affects the bias voltage, it further affects the drift velocity.
| Gas pressure (Torr) | Anode bias (V) | Cathode plate bias (V) |
|---|---|---|
| 70 | +1050 to +1035 | -550 to -500 |
| 80 | +1150 | -550 |
| 100 | +1250 | -600 |
| 110 | +1200 to 1320 | -620 to -600 |
| 125 | +1425 | -650 |
| 130 | +1360 | -725 |
| 150 | +1500 | -700 |
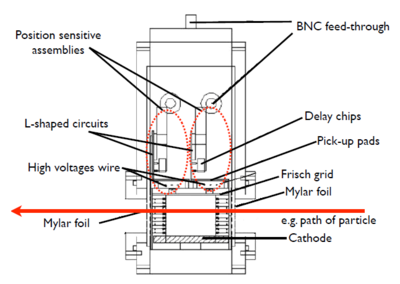
From bottom to top, the cathode plate, drift region (contains four biased field-shaping wire grids), Frisch grid (grounded), three anode wires, and pickup pads (which are with the delay lines). Electrons induced by any radiation will drift upward, pass the Frisch grid, are accelerated by the anodes, and hit the pickup pads. The pickup pads are strips with 45° against the anode wires, almost parallel to the particle trajectories[6]. Each pickup strip is 0.09" (2.286 mm) wide and 1.4" (35.56 mm) long, and spaced 0.01" (0.245 mm). A total of 440 lead-coated copper strips with a 5 ns delay per strip results in a nominal total delay of 2.2 μs. Every 10 strips share a delay chip. The position of the hit position can then be determined by the time difference at the end of the delay line.
There are two position-sensitive delay lines (separated by 42.8625 mm) in the focal plane detector. By reconstructing the particle trajectory using the position information of both delay lines, the resolution can be enhanced by correcting for the kinematic shift of the reaction.
After passing the drift chamber, the particles will be stopped and detected in a plastic scintillator with a photomultiplier tube (PMT) at each end. Together with the energy loss, obtained by the cathode in the drift chamber, a ΔE-E particle identification can be done.
Outline of the algorithm
There are 9 readouts channels from the focal plane detector:
| readout | type of signal |
|---|---|
| cathode | energy loss |
| Front delay line Left | timing |
| Front delay line Right | timing |
| Front anode | energy loss |
| Rear delay line Left | timing |
| Rear delay line Right | timing |
| Rear anode | energy loss |
| PMT Left | energy loss |
| PMT Right | energy loss |
The PID is usually using one of the PMT energy and either the cathode or anode energy.
The coordinate at the Focal Plane is the conventional one, where z-axis is perpendicular to the focal plane detector, y-axis is the vertical, and x-axis is the z-axis cross y-axis. The positions of the front and Rear planes are constructed by the timestamp. Suppose the timestamp is in ns.
The position at the center of the focal plane is
However, for different reactions, there is a z-offset, so that the focal plane is shifted
where is the distance between the front and rear delay lines.
Calculation of the z-offset
The z-offset depends on the reaction, the angle , and the magnetic field of the spilt-pole. Suppose we know the KE and momentum of the ejectile or the interested particle that goes into the split-pole, The reaction is denoted as A(a,b)B, where a is the beam (projectile), A is the target, B is the heavy recoil (residual),and b is the recoil (ejectile).
, where , is the charge number, and is the magnetic field in Tesla.
where is the x-dispersion and is the x-magnification.
Simplification of the z-offset calculation (IW)
The Kinematic Factor k can be re-written as a function of the beam and ejectile momenta:
Inserting that into the offset formula and using gives
,
which only depends on the beam momentum and masses and the spectrograph B, theta. The second order correction (tilt of focal plane) is included in the denominator through the Failed to parse (unknown function "\math"): {\displaystyle \rho <\math> dependence. == Kinematic correction of the focal plane == As pointed out before, the [[Split-Pole_Spectrograph#Kinematic_broadening | kinematic broadening]] can be corrected. In SPS, the dispersion D is 1.96, magnification is 0.39. {|class='wikitable' | style="width: 400px;"| [[File:AnnotatedFocalPlaneRay.png | 400px|frameless| ]] | style="width: 400px;"| [[File:FPShift.gif|frame|]] |- |Simulated rays near the focal plane. || An animation on the shift of the focal panel. An optimum is reached at FP = -42 mm. |} [[File:XavgDiagram.png|thumb| construction of Xavg (X-average) on the virtual focal plan (a liner plane in this case). Need to redraw the picture, the Y-axis should be Z-axis, and it should be rotated 180 degree, so the particle is from bottom to top.]] A parallel shift of the focal plane maybe not be enough. Suppose the best focal plan is given by a function <math> z = f(x) } . The 2 positions extracted from the front and rear delay lines are , and the distance between the front and rear delay lines is . The X-avg is the solution of the equation:
For a linear tilted plane , the X-avg is
SABRE
SABRE is a Silicon Array for Branching Ratio Experiments [7] with the SPS. Its predecessor is the Yale Lamp Shade Array (YLSA). SABRE sits at backward angles from the target and covers roughly 30% of 4π. SABRE has both thick and thin dead-layer detectors, with the thin dead-layer detectors capable of reaching ~200 keV thresholds for protons and deuterons.
CeBrA
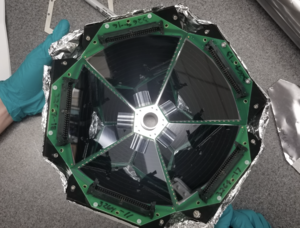
The Cerium Bromide Array (CeBrA) [8] is a γ-ray detector array designed to be used in conjunction with the SE-SPS. Comprised of low-background CeBr3 scintillators with Hamamatsu photomultipliers. There are currently 7 commissioned detectors in the array with varying size crystals (2-1x1 inch, 4-2x2 inch, and 1-3x4 inch crystal detectors; a schematic for the full array on is shown on the right). The goal of CeBrA is to establish coincident events with the light-ions detected in the focal plane detector of the SE-SPS and the corresponding γ-rays from the excited recoiling nucleus, which are called particle-gamma coincidences. The scattering chamber used for CeBrA differs from the usual sliding-seal chamber that is used with the SE-SPS. With a hemisphere shape, it sits at a fixed 35o angle relative to the SE-SPS and allows for a more detailed study of the electromagnetic transitions from nuclei excited in reactions using the SE-SPS.
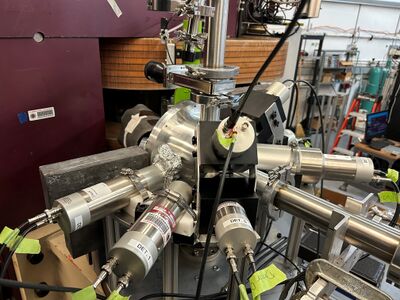
|
| Current array setup for CeBrA as it was used in the Summer 2023 REU experiments studying the 52Cr(d,pγ)53Cr and 34S(d,pγ)35S reactions, which was a follow up from the previous REU from 2022. |
Repositories
Contact
- Jeff Blackmon mailto:blackmon@lsu.edu
- Mark-Christoph Spieker mailto:mspieker@fsu.edu
- Ingo Wiedenhoever mailto:iwiedenhoever@fsu.edu
- who should be contacted?
References
- ↑ 1.0 1.1 1.2 1.3 H.A. Enge, NIM 162, 161 (1979) https://doi.org/10.1016/0029-554X(79)90711-0
- ↑ H. A. Enge, NIM 187, 1 (1981) https://doi.org/10.1016/0029-554X(81)90465-1
- ↑ J. E. Spencer and H. A. Enge, NIM 49, 181 (1967) https://doi.org/10.1016/0029-554X(67)90684-2
- ↑ H. A. Enge, Physics Today 20, 65 (1967) https://doi.org/10.1063/1.3034401
- ↑ C. Marshal et. al, IEEE Tran. Inst. and Meas. 68, 533 (2018) https://doi.org/10.1109/TIM.2018.2847938
- ↑ 6.0 6.1 R. G. Markham and R. G. H. Robertson, NIM 129, 131 (1975) https://doi.org/10.1016/0029-554X(75)90122-6
- ↑ E. C. Good et. al, NIM A 1003, 165299 (2021) https://www.sciencedirect.com/science/article/pii/S0168900221002837
- ↑ A. L. Conley et al., NIM A 1058 (2023) 168827 https://doi.org/10.1016/j.nima.2023.168827








![{\displaystyle D=42.8625~[{\textrm {mm}}]}](https://wikimedia.org/api/rest_v1/media/math/render/svg/5c258d75f39cef086b39421099bd2c0421613a81)


![{\displaystyle P^{2}=(m_{b}+T_{b})^{2}-m_{b}^{2}=T_{b}(T_{b}+2m_{b})~[{\textrm {MeV/c}}^{2}]}](https://wikimedia.org/api/rest_v1/media/math/render/svg/f4c17533cb6f45160186418002ad8cc507612593)
![{\displaystyle \rho ={\frac {P}{cZB}}~[{\textrm {m}}]}](https://wikimedia.org/api/rest_v1/media/math/render/svg/9d4bd942ef35700d6306ff63f4d8b8717c27e4dd)


![{\displaystyle z_{o}=-\rho \delta _{x}M_{x}k[{\textrm {m}}]}](https://wikimedia.org/api/rest_v1/media/math/render/svg/683f32c8d1fccc861f015367bb34f04145f80622)


